Load Testing with Apache JMeter.

Now that we have learnt about the difference between Siege and Apache JMeter in the previous article, it’s time to talk about running basic HTTP api load tests with JMeter.
JMeter is a pure Java application and should run correctly on any system that has a compatible Java implementation.
One can download and install apache JMeter from here.
Open it and let’s get started. You’ll see an empty Test Plan as below.
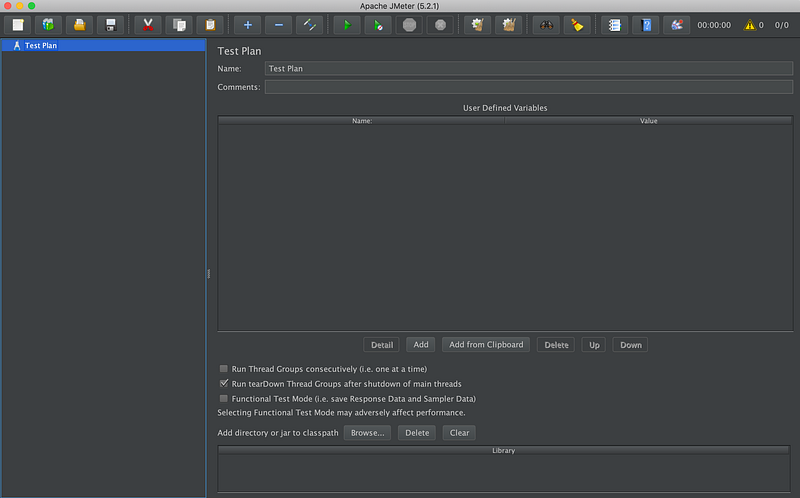
Test Plan is where you can describe the name of your tests and add comments about it. We’ll keep the name Test Plan for the sake of reference.
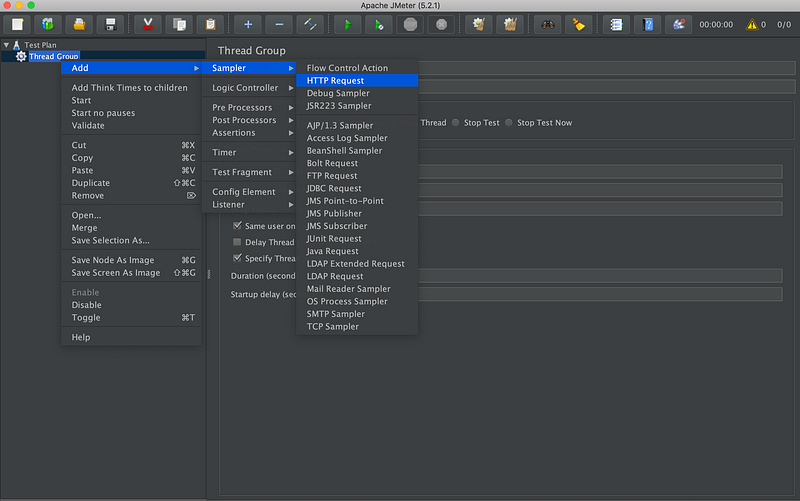
Right click on the Test Plan and add Thread Groups as shown below:

A Thread Group is where you specify the number of users that you want to simulate. One thread = one user.
Number of threads: It is where you specify the number of users that you want to simulate. One thread = one user.
Ramp Up Period: By setting the ramp-up period, you can also tell JMeter how long it should take to reach all of the threads that you’ve chosen.
Loop Count: You can set the number of iterations for each user in the group using Loop Count.
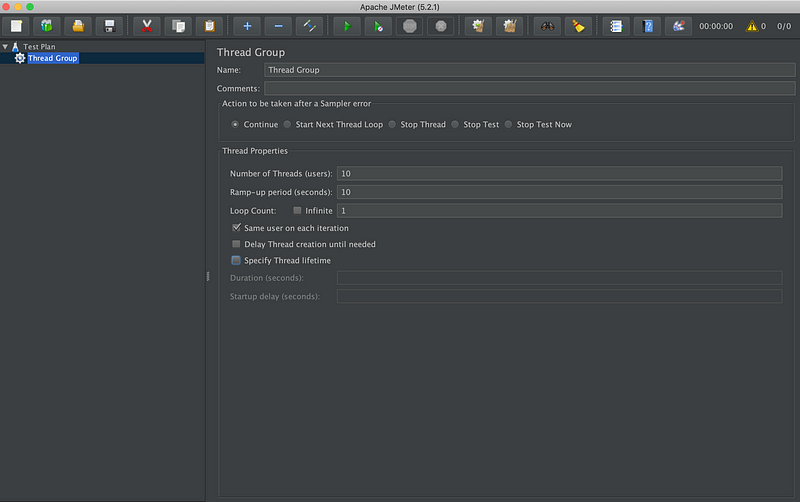
For example, the above configurations with:
Number of threads: 10, Ramp-Up period: 10 seconds and Loop Count: 1 means that JMeter will take 10 seconds to get all the 10 threads up and running. Each thread will start after 1 (10/10) second after the previous thread had begun. A total of 10 requests will be made, since loop count is 1.
Note that the ramp up period is obeyed only for the first loop. If the loop count was 2, the second request for each thread would start after the response of first one is received.
Each thread will wait for the response from previous call and start the next request till the number of loop counts are over.
The loop count can be infinite and one can run concurrent threads for a specific amount of time by checking on Specify Thread Lifetime and adding Duration say 60 seconds.
Now that we have specified Thread Group, we can specify what that thread is actually going to execute, say an HTTP request to a server in our case.
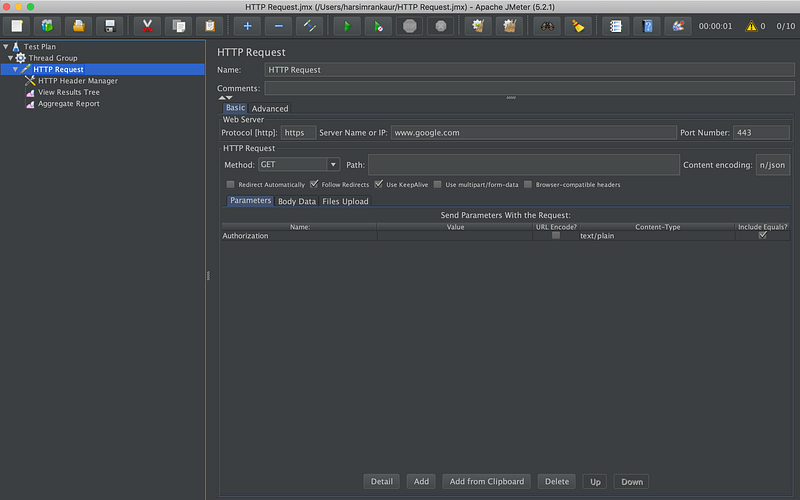
One can configure a simple HTTP request as given below.
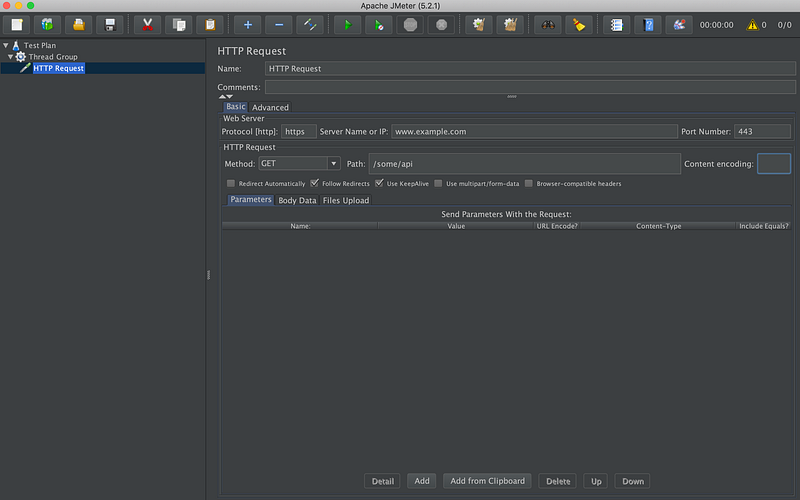
Use KeepAlive sets header Keep-Alive in http request, which would mean that only initial request will have latency involved with connection setup, the subsequent requests will use the same TCP socket. Hence the tests will check the real load the application can handle, without taking into account the latencies to establish a TCP handshake.
In case one wants to add http header like an Authorization token, one can do so by adding a Config Element like HTTP Header Manager.
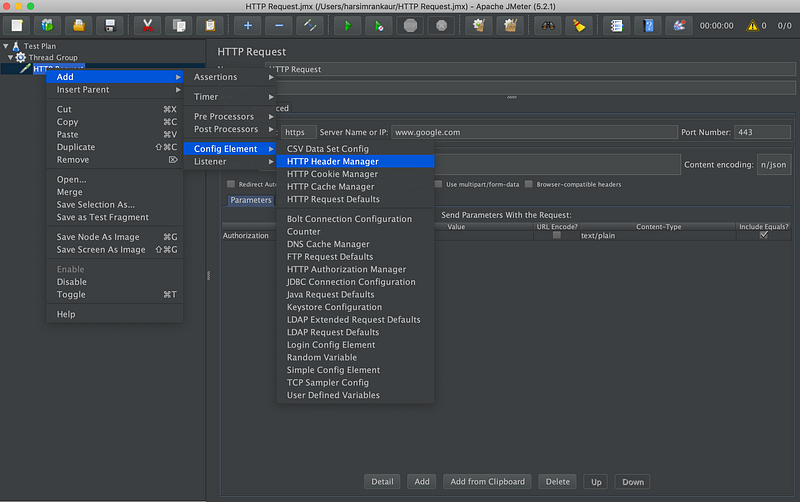
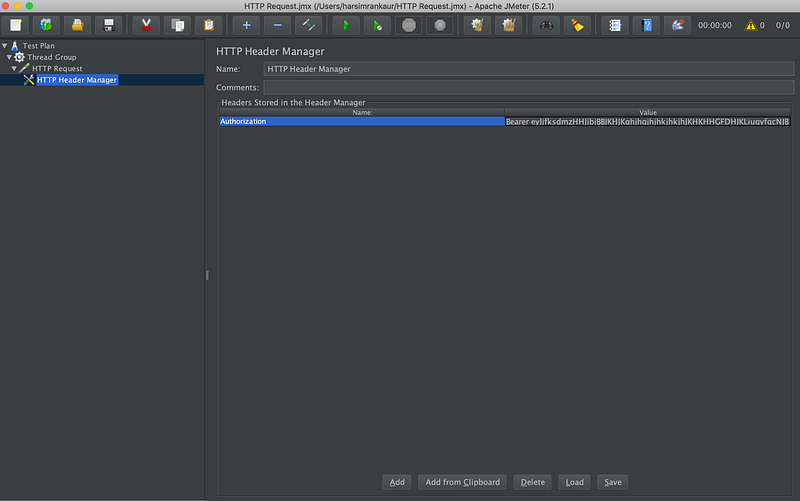
Now that we have an HTTP Request ready, we need a setup to analyse our test results. JMeter by default has a number of options for listeners. View Results Tree is used very frequently since it shows the response of each request and hence makes it easier to detect in case something goes wrong. In addition to it, one can use Aggregate or Summary Report to get a general idea about overall throughput and performance of the apis.
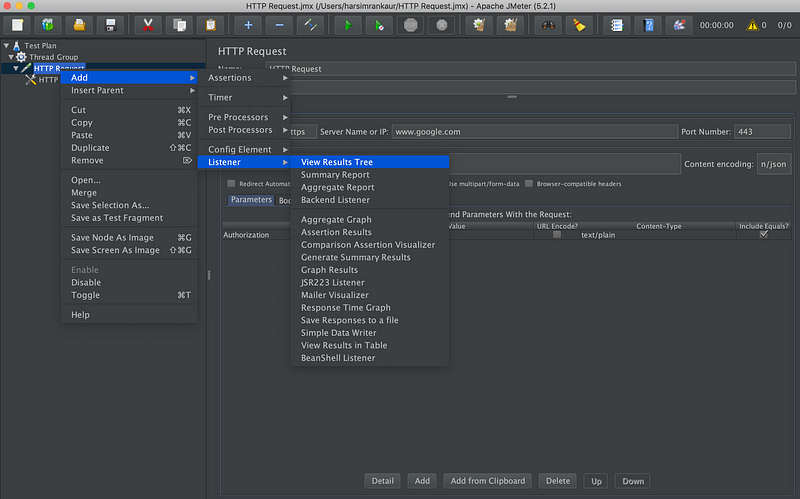
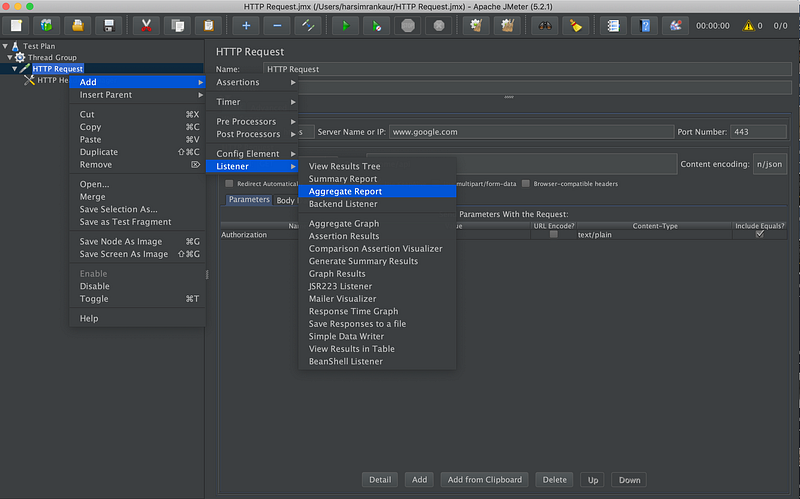
Now that we have 2 listeners set up, we can start the test by clicking on start button. Once the tests are over, the results can be seen in the listener sections.
Hope this acts as a good introduction to JMeter. Reach out to me in the comments section in case you have further queries.
Happy Load Testing!