Load testing tool comparison: Siege vs Apache JMeter.

Why load test?
Imagine a scenario where people are waiting at the airport to do the COVID-19 test before they could get home. And the only way they can register for that test is by using your app. Now imagine their frustration if your app fails to load, or some of your apis fail because they are not performant enough.
Had you had load tested your services, you would have an idea how much load your services could handle and what steps you would need to take in order to enable your services to handle bigger load while optimising the cost of resources. Remember, the solution for every performance problem might not always be to increase the number of servers, at least not always the optimum and a cost effective solution.
How?
When I started load testing our apis at my company, we started using siege.
Siege
It is a simple command line load testing tool.
It can stress test a single URL with a user defined number of simulated users, or it can read many URLs into memory and stress them simultaneously. The program reports the total number of hits recorded, bytes transferred, response time, concurrency, and return status.
It is a great tool if you want to get a general idea of how your apis behave, without having to invest a lot of time.
Below are some advantages from a practical perspective.
- Lightweight and easy to get started with. One can simply download the tool and start testing their apis using simple command like:
siege -c5 -t1m -d3 https://your.server.apiThe above command triggers 5 users making the requests to the server for a time period of 1 minute, with a delay of 3 seconds between requests.
- Supports triggering of multiple concurrent requests with different URLs or different request bodies using a file.
siege -c100 -r1 -H ‘content-type: application/json’ -f siege.txtThe above command reads the first 100 api requests from siege.txt file in memory and fire them simultaneously single time.
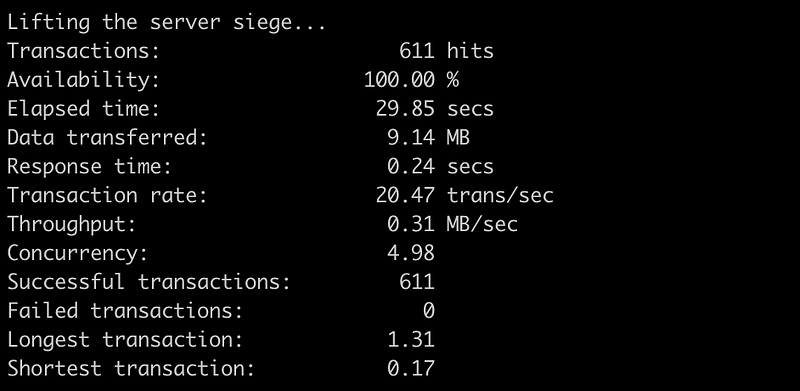
This is how a sample result may look like:
However there are some pitfalls one needs to be aware of:
- Siege results also account for network latency, i.e the time it took for your requests to reach the server. Hence it is only useful to test your apis locally or get a general idea about the behaviour and relative (compared to other apis on the same server) throughput.
- It only supports HTTP/1.0 and 1.1 protocols, the GET and POST directives, cookies, transaction logging, and basic authentication. If one plans to go beyond that for their tests, one needs to consider a more advanced tool.
Apache jMeter
The above limitation prompted us to switch to jMeter, as most other open source load testing tools don’t support PUT, DELETE apis. Apache jMeter is a GUI based load testing tool based on Java. It offers a lot of flexibility with what you can test, and how you can interpret results.
But as with all things that offer more, it can be confusing to get started with (don’t quote me on that), and might take some time to do the initial on boarding. Some of the advantages are:
- Allows to get more accurate test results without accounting for network latency. By turning on KeepAlive option in HTTP requests, one can keep the same TCP connection open and hence calculate the real throughput of your server. More on it here.
- It offers multiple ways to analyse your results.
- It has extension capabilities using plugins. e.g. creating random numbers
This is how a sample aggregate report from jMeter looks like:

Conclusion:
If you’re looking for a getting a general idea for your api behaviour and have very less time, siege is a good option. However if you want to do some advanced testing and have some time to invest for initial learning, go ahead and use jMeter.